Electron & New Relic Integration Using Open Telemetry
Introduction
Recently I encountered a scenario where I needed to integrate New Relic into my Electron application. New Relic supports a number of integration types our the box, some of the more heavily used ones are,
- APM Agents - Primary used for backend tracking, most of the documentation will point to integrating in this style.
- Browser Agent - Used for front end client side logging.
Integrating the browser agent was a simple task of adding a logging script to the HTML page hosting the app ... easy so far. Because Electron is effectively loading up a chromium browser, the browser agent should work as normal. The APM Agent on the other hand was a different story, after having scoured the internet I found that its currently not supported with Electron. In fact if you look at the documentation for Electron, there is a suspicious absence of logging documentation. This might be down to the unique way Electrons IPC channels (inter-process-communication, allows for backend and front end communication using an event based model) work.
Due to this I knew we would require a manual approach to logging, this is where Open Telemetry comes into play. Using Open Telemetry we can bootstrap the app on startup and start manually adding tracing logs in any backend IPC handler. Since most logging providers now support Open Telemetry, including New Relic we have a mechanism to export out logs out.
This article was created as a complete guide to the approach mentioned above. Due to the lack of examples and documentation online I hope this article comes in use for someone. In the example below I was using Electron with Vite and Typescript.
Installing Dependencies
To get started open telemetry has a couple of packages that need installing,
1npm install @opentelemetry/api
2npm install @opentelemetry/auto-instrumentations-node
3npm install @opentelemetry/exporter-trace-otlp-http
4npm install @opentelemetry/instrumentation
5npm install @opentelemetry/resources
6npm install @opentelemetry/semantic-conventions
Bootstrapping the App
The first step to integration is to connect into the startup process of Electron and instrument our Open Telemetry tracer. As Open Telemetry allows you to export your logs to multiple 3rd parties the example below will first show you how to get started with Jaeger an open source tracing sink and then expand this to New Relic.
Hooking into Startup
The first part of coding is to hook into the startup process your application. Electron conveniently has a whenReady() function that is called when electron has finished initialising. We can make use of this function to register our tracer.
Let's first start by creating a tracing.ts file in the root of the application. In this file we will have two functions, one to register a tracer and another to get the tracer. We are also going to pass through some useful information to the tracer like the application version, and operating system so that all our logs have some base information they can relay back to New Relic.
1export const registerTracer = (appVersion: string, operatingSystem: string): void => {
2	//Registration code here
3}
4
5export const getTracer = (): Tracer => {
6	//Code to get tracer here
7}
Next we can call the register function on startup,
1import { app } from "electron"
2
3app.whenReady().then(() => {
4	//For me this is the version defined in my package.json
5	const appVersion = app.getVersion();
6	//Part of NodeJS's way of detirmining the platform
7	const operatingSystem = process.platform;
8
9	registerTracer(appVersion, operatingSystem);
10});
Configuring the Tracer
Now that we have some functions to hook into we can flesh them out with our configuration. For ease of copy and paste im going to first code dump and the file then explain each part.
1/*tracing.ts*/
2import { BatchSpanProcessor } from "@opentelemetry/sdk-trace-base";
3import { Resource } from "@opentelemetry/resources";
4import { SemanticResourceAttributes } from "@opentelemetry/semantic-conventions";
5import {
6  NodeTracerProvider,
7  SimpleSpanProcessor,
8} from "@opentelemetry/sdk-trace-node";
9import { registerInstrumentations } from "@opentelemetry/instrumentation";
10import { OTLPTraceExporter } from "@opentelemetry/exporter-trace-otlp-http";
11
12import opentelemetry, { Tracer } from "@opentelemetry/api";
13import { getNodeAutoInstrumentations } from "@opentelemetry/auto-instrumentations-node";
14
15const NEWRELIC_APP_NAME = "APP NAME GOES HERE";
16const IS_DEVELOPMENT = import.meta.env.DEV;
17
18export const registerTracer = (appVersion: string, operatingSystem: string): void => {
19  registerInstrumentations({
20    instrumentations: [
21      getNodeAutoInstrumentations(),
22      //TODO: Add an instrumentation library here when electron is supported
23    ],
24  });
25
26  const resource = Resource.default().merge(
27    new Resource({
28      [SemanticResourceAttributes.SERVICE_NAME]: NEWRELIC_APP_NAME,
29      [SemanticResourceAttributes.SERVICE_VERSION]: appVersion,
30      [SemanticResourceAttributes.OS_NAME]: operatingSystem,
31    })
32  );
33
34  const provider = new NodeTracerProvider({
35    resource: resource,
36  });
37
38  const otlpExporter = new OTLPTraceExporter({
39	//Jaeger tracing url
40	url: 'http://localhost:4318/v1/traces'
41  });
42
43  const processor = IS_DEVELOPMENT
44    ? new SimpleSpanProcessor(otlpExporter)
45    : new BatchSpanProcessor(otlpExporter);
46
47  provider.addSpanProcessor(processor);
48  provider.register();
49};
Note import.meta.env is just Vite's way of getting hold of environment variables.
You might firstly notice that there is a TODO in the code, if and when Electron supports a plugin style integration with open telemetry, the instrumentations array will be the place to add it. For now we are manually instrumenting the app.
The resources section is given to use using the @opentelemetry/resources and @opentelemetry/semantic-conventions packages. It allows us to define some base properties we want to show in all our tracing logs. Obvious things like the app version, and operating systems (especially if your targeting multiple systems) are really useful bits of information to add. There are also some built in attributes for Kubernetes and oddly enough AWS (with some generic ones for other cloud providers).
In terms of the OTLPTraceExporter block, as we opted to do our tracing using HTTP (GRPC is also an option) with the package @opentelemetry/exporter-trace-otlp-http i have added some basic settings for Jaeger. Note that you can add a number of exporters here, and we will also be extending this to include New Relic.
The final part in question is the processors themselves, open telemetry has a few options on how you might want to push your logs to 3rd parties. Ive opted to use a SimpleSpanProcessor when running the app locally so that my logs are immediately pushed to the servers when testing things out. However in production im making use of a BatchSpanProcessor that batches a group of logs and then pushes them in one go. This helps reduce network traffic of the app.
Exposing a Tracer
In order to get an actual tracer we can get an instance from the global tracing provider using the getTracer() function. This tracer object then allows us to create logs in the shape of a snap. It is advised to call getTracer every time you need to start logging as opposed to maintaining your own instance.
1export const GetTracer = () : Tracer => {
2  return opentelemetry.trace.getTracer(NEWRELIC_APP_NAME);
3}
Adding a Tracing Example
Now that we have added all our logging code we can finally create an actual log entry. To do this we can create a new span, in which we can raise new events and record exceptions. In the example below i've added some logging to an IPC handler.
1import { ipcMain } from 'electron'
2import { GetTracer } from './tracing'
3
4const createWindow = () => {
5	//Create new browser window
6	ipcMain.handle("getDinosaurs", async () => {
7		await GetTracer().startActiveSpan("getDinosaurs", async (span) => {
8			//await getDinosaurs()
9
10			//Record one or many events in your code blocks
11			span.addEvent("receivedDinosaur", { name: dinoName  });
12			//Record exceptions in your code block
13			span.recordException(new Error(`Ops their all extinct!`));
14			span.end();
15		});
16	});
17}
Testing with Jaeger
To test this out with Jaeger you can first execute the following docker command to create a new instance of Jaeger with OTLP enabled.
1docker run -d --name jaeger \
2  -e COLLECTOR_ZIPKIN_HOST_PORT=:9411 \
3  -e COLLECTOR_OTLP_ENABLED=true \
4  -p 6831:6831/udp \
5  -p 6832:6832/udp \
6  -p 5778:5778 \
7  -p 16686:16686 \
8  -p 4317:4317 \
9  -p 4318:4318 \
10  -p 14250:14250 \
11  -p 14268:14268 \
12  -p 14269:14269 \
13  -p 9411:9411 \
14  jaegertracing/all-in-one:latest
Once up and running you can navigate to the default UI url http://localhost:16686/ to start viewing your logs. It order to get something showing up you will need to run the app and begin pushing some logs to Jaeger.
Setting up New Relic
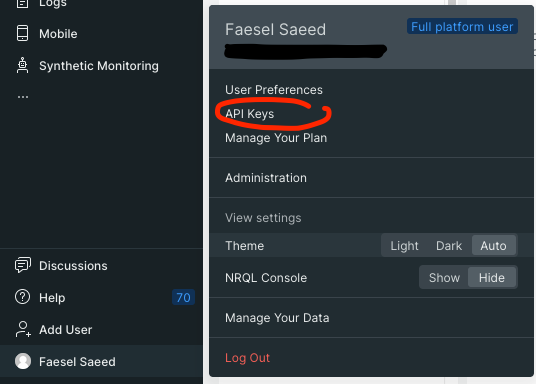
Everything is now setup from a code perspective, its time to create everything we need in New Relic. This step is quite quick and painless, a new key can be created from the API Keys section. Once there follow the Create a Key button. The form requires the following,
- Account - Set this to whatever you want
- Key Type - Set this to Ingest - Licence
- Name - Set this to whatever you want, however it does make sense to match this up with the service name set in the section "Configuring the Tracer"
Once thats created you should get an option to copy the key which is passed into your OTLPTraceExporter. As for the URL you can find New Relics OTLP endpoints on this link. Now that we have the settings needed we can change the OTLPTraceExporter to include the New Relic settings.
1const otlpExporter = new OTLPTraceExporter({
2	url: 'https://otlp.nr-data.net:443',
3	headers: {
4	  "api-key": `API KEY GOES HERE`,
5	},
6});
Once setup you will need to send your first log before anything appears in New Relic. Once you have results will show up in APM & Services > Services - OpenTelemetry > Click on your app name > Distributed Tracing. You can drill down to view the span events and attributes.
New Relic also has a second method of viewing your logs through the use of NRQL queries. You can query your data by visiting Query Your Data and entering the following query,
1SELECT *
2FROM SpanEvent WHERE span.id IN (
3	SELECT id FROM Span WHERE otel.library.name = 'YOUR APP NAME HERE'
4)
And thats it, hope this was useful for someone! Before you get integrating note that there might be some logging providers that have a much easier integration with New Relic, sentry.io seems like one of them.
Comments